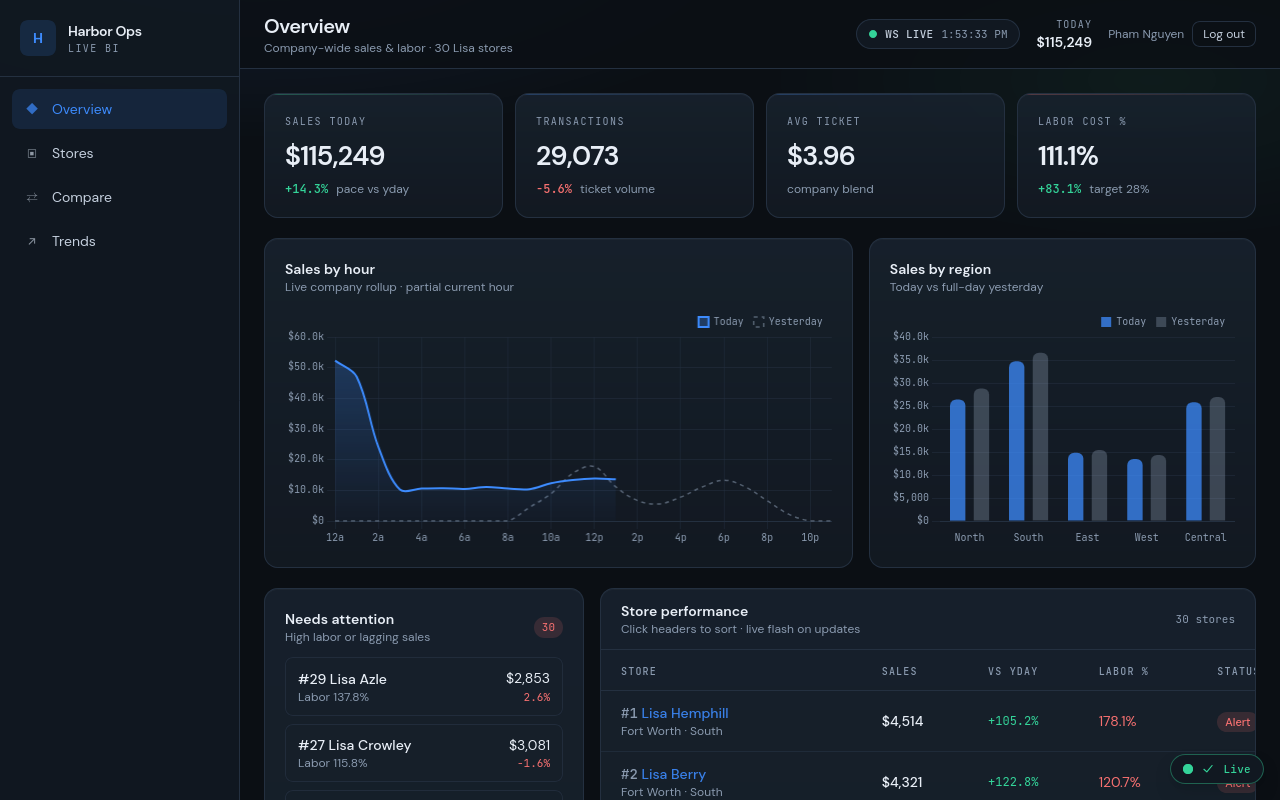
Overview
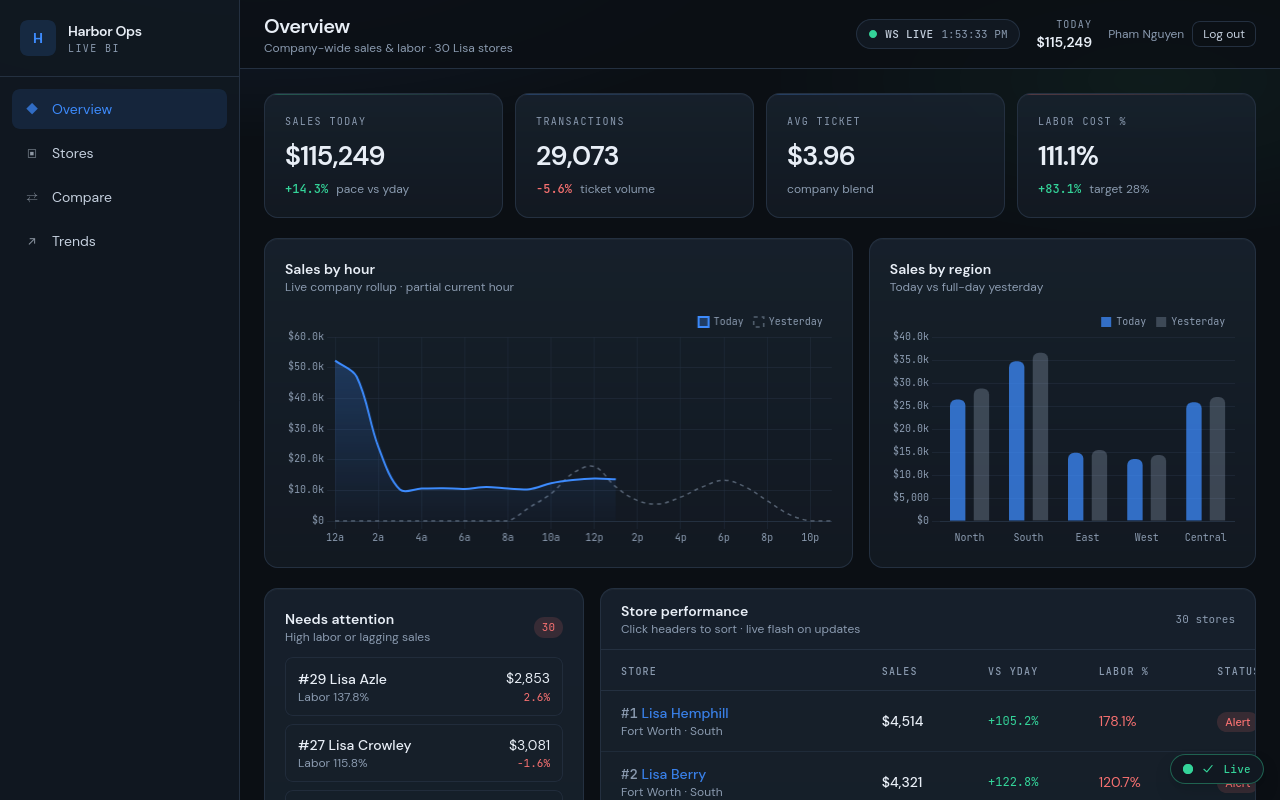
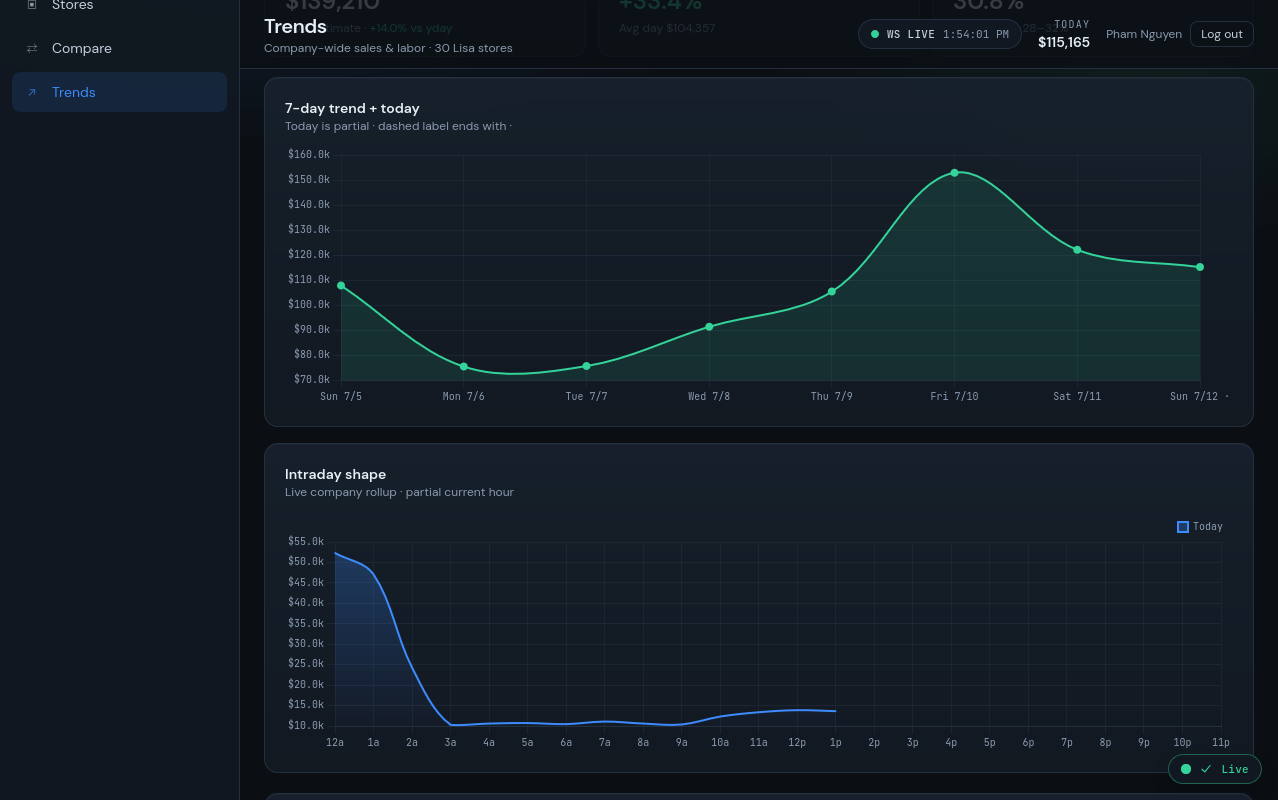
A real-time business intelligence dashboard built for a restaurant group operating 20+ locations. It gives management a live view of sales and store performance in place of the hours-long manual reporting process it replaced — company-wide KPIs, store rankings, and trend views update as sales happen.
The production system runs on Vue, a Node.js/Express API, and MySQL, with a WebSocket layer streaming POS activity to connected clients. This deployed version rebuilds that same pipeline against a simulated store feed, since the original runs on the company's live data.
The problem
Management running 20+ stores had no way to see how the day was going until reports were compiled by hand after close — a process that took hours and left decisions lagging behind what was actually happening in stores.
Architecture
A Node.js/Express API reads and aggregates sales data from MySQL into company- and store-level metrics. A WebSocket layer pushes updates to connected clients as new POS activity comes in, so the Vue frontend reflects current-day performance without polling. This portfolio build reproduces that pipeline with a simulated store feed in place of the real POS integration.
Highlights
- —Visibility across 20+ locations Company and per-store KPIs update as sales happen, replacing manual end-of-day rollups.
- —Hours-to-minutes reporting Daily reporting that used to take management hours to compile is now available in minutes.
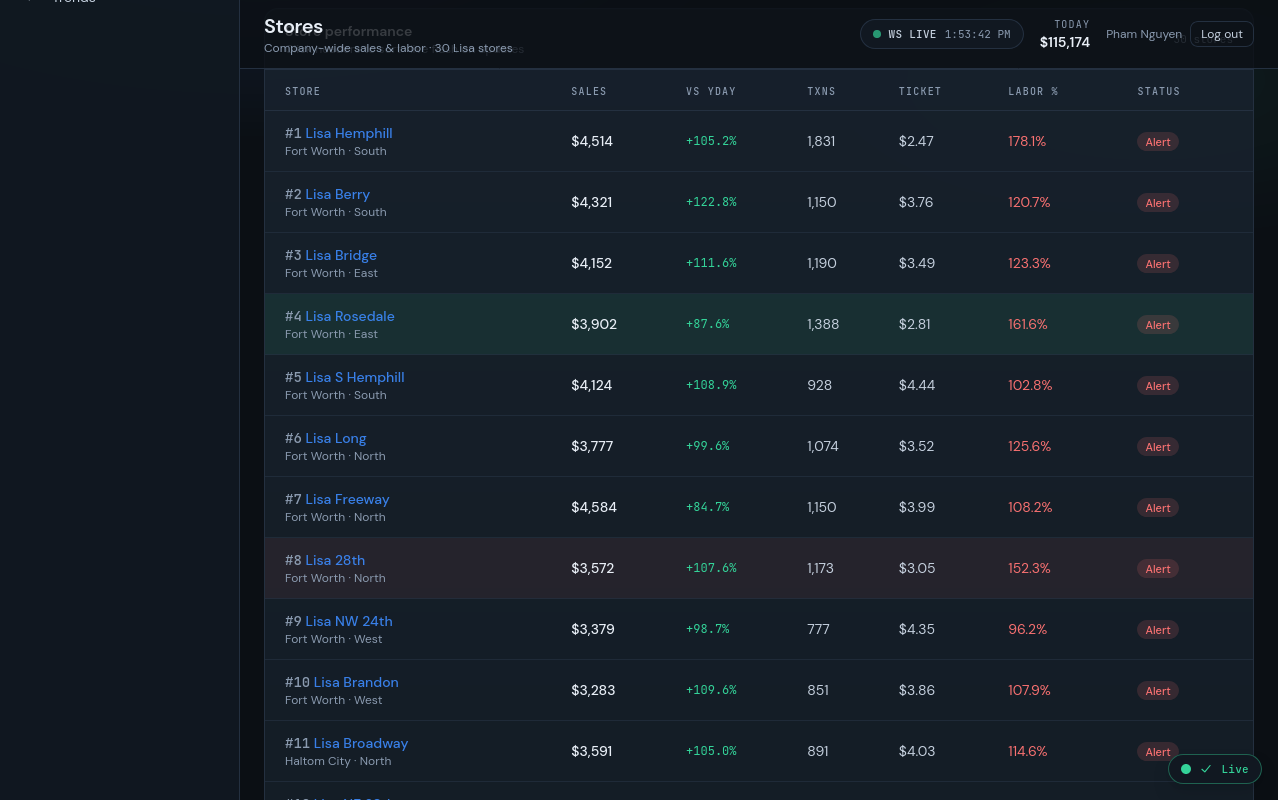
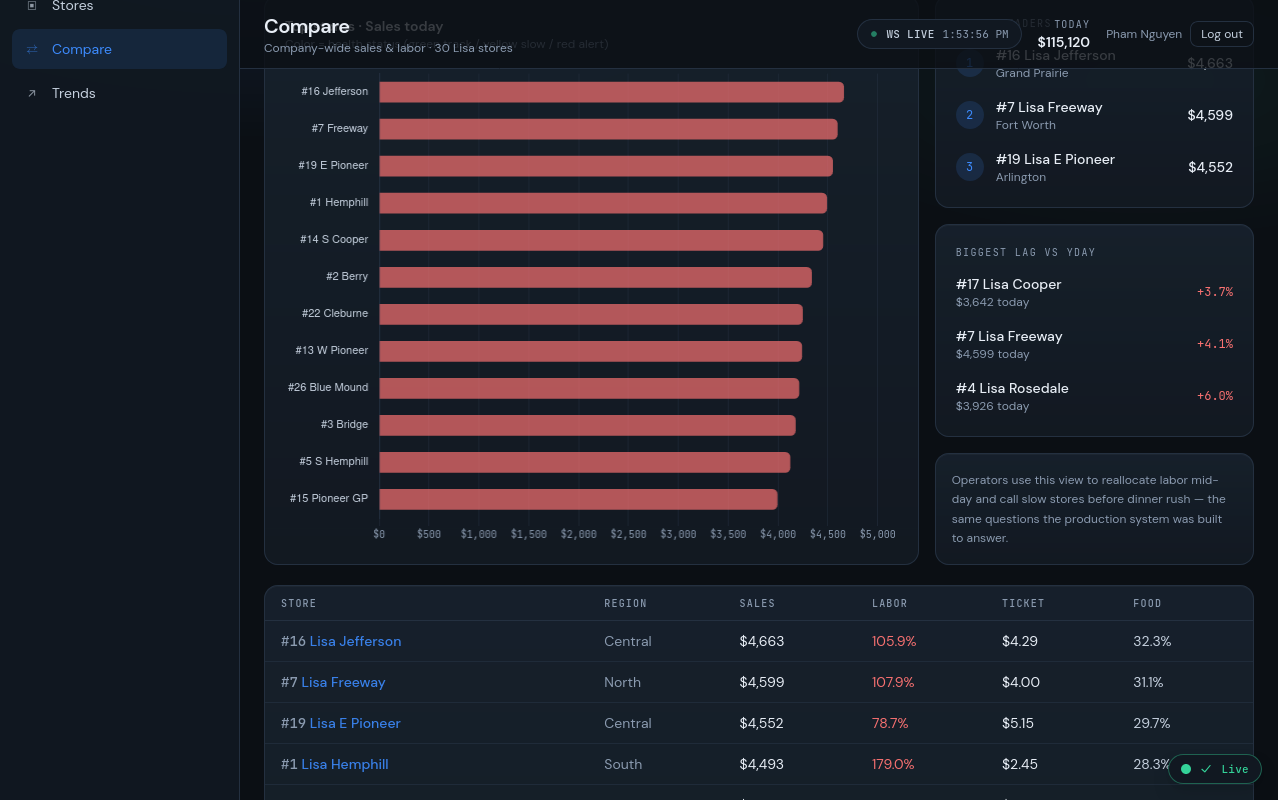
- —Store-level drill-down Per-store views and rankings help managers spot underperforming locations without digging through spreadsheets.
- —MySQL-backed aggregation Metrics are computed from MySQL sales data, keeping the dashboard consistent with the source of truth.
Screenshots